How to Read/Use the Stack Trace
The stack trace displays information useful for both debugging or troubleshooting, as well as identifying areas of code execution that might benefit from using some performance optimization techniques, such as caching, or possibly even rewriting the code to run more efficiently.
Each item in the stack trace is listed in the order in which it was encountered during the execution of the request. Some items in the list simply display informational messages, and don't necessarily point to any specific line of code, while others output the entire path to the file or method being parsed.
In the parenthesis to the right of each item in the list are two numbers. The number on the left indicates the number of milliseconds it took the server to parse the specific file or method, while the number on the right reflects the point in the total request (in milliseconds) when the file or method finished executing.
So, for example, if you review the following stack trace, note item number 14.
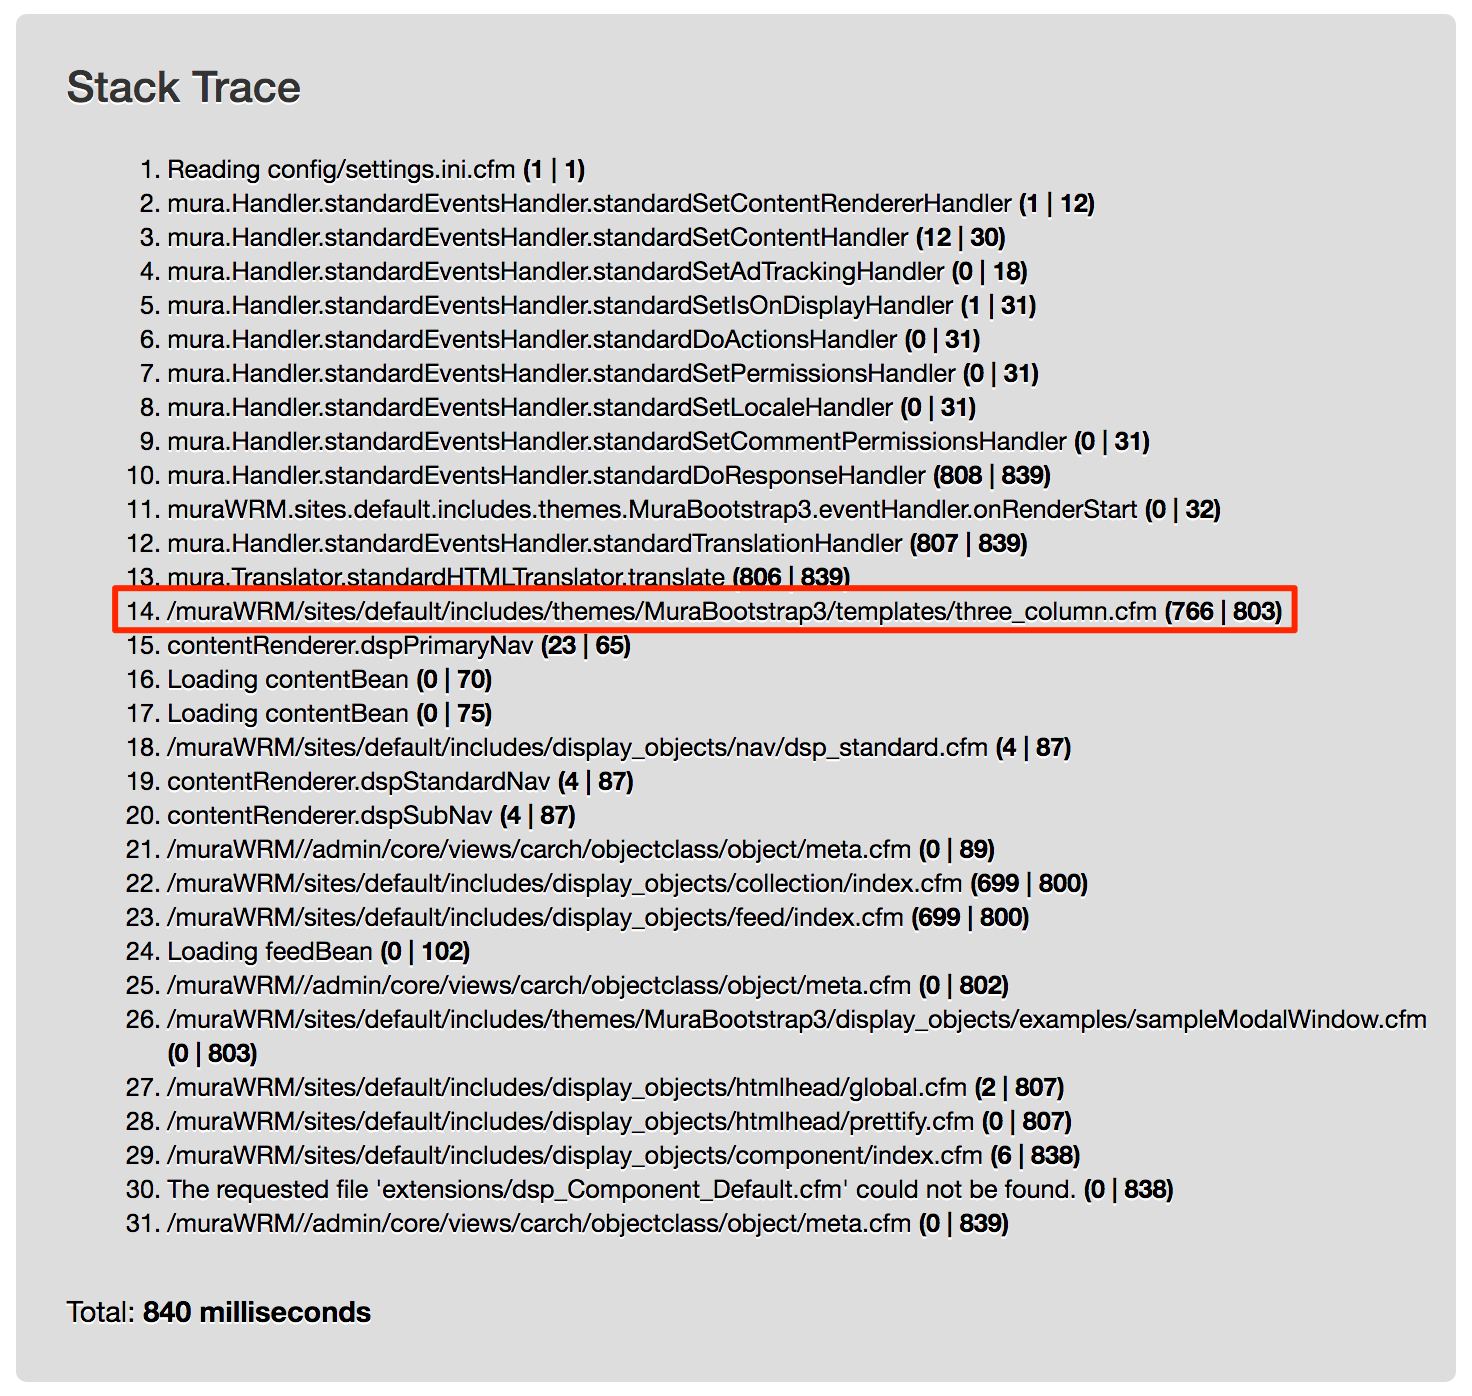
Item number 14 indicates that Mura was parsing the three_column.cfm layout template, and it took the server a total of 766 milliseconds to execute, and completed its execution at the 803rd millisecond.
Item number 15 indicates a method call to contentRenderer.dspPrimaryNav, which in turn was invoked during the execution of parsing the three_column.cfm file. The dspPrimaryNav method finished executing at the 65th millisecond. Subsequent items were then executed in the order listed.
While you may not necessarily have the ability to optimize some of Mura's core methods, you can see the three_column.cfm layout template is code you have direct control over. Maybe some of the code within the layout template could benefit from using a caching strategy, or some other form of performance optimization.